Working to make government more effective

General election 2024: The precarious state of the state

The precarious state of the state: The economy

A sluggish pandemic recovery and high inflation squeezed UK living standards in the last parliament.

Bank of England
Rises to the Bank of England's interest rate are among factors that have squeezed living standards in the past few years.

The state of the economy is always a big theme in elections. It not only directly affects the material wellbeing of the voting public but is also a key determinant of the state of the public finances – and so what political parties can credibly promise when it comes to their tax and spending plans. It is particularly important in this election, with a cost-of-living crisis that has seen millions of people struggle, and with faltering public services.

The UK economic recovery from the pandemic has been slower than other advanced economies

The most recent statistics show that the economy – as measured by Gross Domestic Product (GDP) – grew by 0.6% in the three months to March 2024, the fastest growth rate for nearly three years. 17 Office for National Statistics, ‘GDP first quarterly estimate, UK: January to March 2024’, Office for National Statistics, 10 May 2024, retrieved 31 May 2024, www.ons.gov.uk/economy/grossdomesticproductgdp/bulletins/gdpfirstquarterlyestimateuk/januarytomarch2024 However, this should be viewed in the context of much deeper structural challenges. The UK has had one of the slowest recoveries from the effects of the Covid pandemic among major advanced economies, partly reflecting the UK’s vulnerability to higher energy prices after Russia’s invasion of Ukraine in 2022.

What little GDP growth the UK has had over the past few years has been driven by increases in the overall size of the population. GDP per person has only just started growing after two years of contraction, and the Office for Budget Responsibility (OBR) forecasts that it will not return to its pre-pandemic level until 2025. 18 Office for Budget Responsibility, Economic and Fiscal Outlook – March 2024, Cm 1027, The Stationery Office, 2024, retrieved 31 May 2024, www.obr.uk/efo/economic-and-fiscal-outlook-march-2024/

A fall in people working or looking for work has slowed the economic recovery

Another reason for the UK’s slower post-pandemic recovery is the fall in the percentage of working age people who are either employed or looking for work. This has been driven by a large increase in the number of people inactive due to long-term sickness, alongside a rise in the number of students and carers. Policies in recent budgets – such as cuts to national insurance contributions and expansions of childcare – have attempted to reverse this trend, though the participation rate is still well below where it was before the pandemic.

Inflation has now fallen, though higher prices and low productivity have squeezed real wages

The increase in energy prices that began after Russia’s invasion of Ukraine led to large increases in household electricity and gas bills that spread into the wider economy, causing a sharp dip in real wages in 2022 and 2023 as the pace of price rises overtook pay growth. Real wages have now started to grow again as inflation has come down – almost to the Bank of England’s 2% target.

In the longer run, though, low productivity has held down real wages: these are currently below where they were just before the 2008 financial crisis. Many advanced economies have suffered with poor productivity since the crisis, but this has been particularly pronounced in the UK. 20 Van Ark B and O’Mahony M, ‘What explains the UK’s productivity problem?’, blog, Economics Observatory, 15 January 2024, retrieved 31 May 2024, www.economicsobservatory.com/what-explains-the-uks-productivity-problem

Households and businesses have had to contend with much higher interest rates since 2022

Mostly to counteract the surge in inflation, the Bank of England has raised the bank rate (the interest rate that it pays to commercial banks) from a record low of 0.1% in late 2021 to the current rate of 5.25%. This in turn increases the interest rate that banks will pay out on consumer savings – but also what they charge on their mortgages and loans.

Although the bank rate is expected to be reduced later in the year, anyone remortgaging a fixed-rate mortgage is still likely to experience a significant hike in their monthly payments, which will have a depressing effect on household consumption over the next couple of years.

Standards of living will not return to their pre-pandemic level until 2025

The fall in real wages in 2022 caused the second largest year-on-year fall in living standards since records began in the 1960s, as measured by real household disposable income per person. This fall would have been even larger were it not for the introduction of generous support schemes such as the Energy Price Guarantee. 

This measure of living standards increased in 2023 and is expected to continue growing in the medium term, returning to its pre-pandemic level by 2025, supported by the recovery from the energy price shock and recent cuts to the main rates of national insurance. However, the ongoing ‘fiscal drag’ from frozen personal tax thresholds, which both parties have said will remain in place until 2028, offsets around a third of the gains from these policies.

Tax and spending have increased to levels not seen in decades

Total public spending (shown in pink above) rose from 39.6% of GDP in 2019/20 to 44.0% in 2024/25 and was much higher still during the pandemic. Over the same period, tax revenues (which account for most but not all government receipts, in pale blue above) rose from 33.1% to 36.5% of GDP, although were depressed somewhat in 2019/20 by the effects of the pandemic. The largest single tax increase in this parliament has been the decision not to increase personal allowances and higher-rate thresholds in line with inflation, the ‘fiscal drag’ noted earlier, which has raised much more than originally anticipated because inflation has been so high.

Tax revenues are now at a level not seen since 1950 and public spending at a level not seen outside crises since the mid-1970s. Both outstrip changes in most other advanced economies, according to the IMF. 23 International Monetary Fund, ‘World Economic Outlook Database: April 2024’, International Monetary Fund, (no date) retrieved 31 May 2024, www.imf.org/en/Publications/WEO/weo-database/2024/April  Although recent changes have been fast, the UK’s tax to GDP ratio is in the middle of the pack when comparing with other advanced economies. 24 Organisation for Economic Cooperation and Development, ‘Revenue Statistics 2023: the United Kingdom’, Organisation for Economic Cooperation and Development, 2023, www.oecd.org/tax/revenue-statistics-united-kingdom.pdf

General election 2024

The next UK general election will be held on Thursday 4 July. Our analysis, explainers and events explore what happens before and during an election, how political parties and the civil service prepare for the outcome and what it means for government.

Find out more
Prime minister Rishi Sunak issues a statement outside 10 Downing Street, London, after calling a general election for 4 July.

Borrowing has remained persistently high

Despite the tax increases, higher public spending has meant that public sector net borrowing (the shaded area between the pink and dark blue lines above) has risen. The figure stood at 2.7% of GDP in 2019/20 before rising sharply during the pandemic; it is expected to remain at 3.1% of GDP in 2024/25.

The current government’s plans as of the March 2024 budget were for public spending to be cut relative to the size of the economy over the next parliament, reaching 42.5% of GDP by 2028/29. Tax revenues are forecast to increase further, to 37.1%. This is intended to be achieved by, among other things, continuing to freeze income tax thresholds and raising fuel duty by 5p and then in line with inflation from April 2025. This would result in borrowing falling to 1.2% of GDP, which if achieved would be the lowest level of public borrowing since 2001/02.

Announcements from the Labour Party so far suggest that its fiscal plans are broadly similar to the government’s. However, it has announced that it would spend a little more (for example, through additional green investment) and tax a little more (for example, through applying VAT on private school fees, changing the tax treatment of carried interest for private equity investors and tackling tax avoidance). But both parties have ruled out increasing the rates of any of the largest taxes including income tax, VAT and national insurance contributions.

Fiscal rules are being met by the tightest of margins and on the basis of implausible spending assumptions

Both the Conservatives and Labour are committed to achieving the same target  that debt should be on course to fall as a share of GDP between the fourth and fifth years of the latest forecast period. At the March budget, that meant debt had to be on course to fall between 2027/28 and 2028/29, though at the next forecast the horizon at which the rule must be met will roll forward an extra year.

This is a very loose fiscal rule compared to the debt targets that previous UK governments have tried to adhere to. However, given the current state of the UK’s public finances it still imposes severe constraints on how much more either party would be able to borrow. As the chart shows, the plans set out by the government in the March 2024 budget were only just consistent with that target: chancellor Jeremy Hunt had £8.9bn of headroom against this rule.

An Institute for Government chart showing the OBR forecasts of headroom against targets at fiscal events from June 2010 to March 2024-2028.

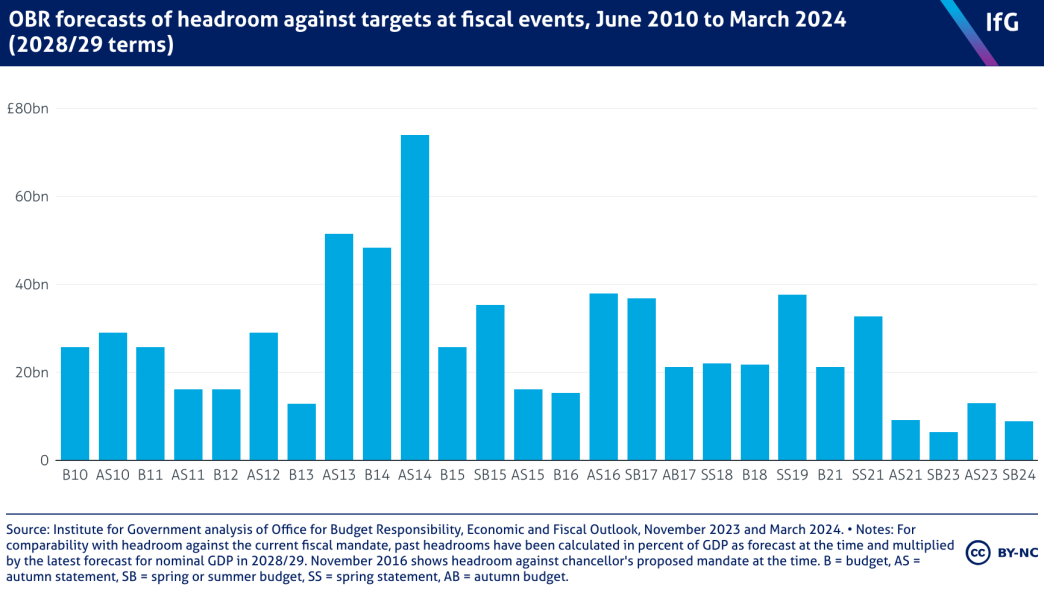
The amount of headroom that the government currently has against its target for debt to be falling in five years’ time is small – indeed Jeremy Hunt has averaged headroom at around a third of levels previous Conservative chancellors have maintained against their fiscal rules since 2010.   This headroom is supposed to provide the chancellor with some flexibility to absorb economic and fiscal shocks without needing to change fiscal policy. Having such a small amount of headroom makes it more likely that a chancellor will be forced to adjust policy in response to relatively small forecast changes if he or she wants to remain on course to meet this target for debt. 

And even this historically low level of headroom is only achieved through several questionable assumptions about the path of future policy that both parties have implicitly signed up to. Fuel duties have been frozen or cut in cash terms in every year since 2011, making the mooted 5p increase and subsequent uprating in line with inflation highly implausible. Income tax thresholds have already been frozen for the past two years, pushing more people into paying income tax or beginning to pay tax at the 40% marginal rate. A further four years of cash freezes will be difficult to maintain. But most significantly, public spending plans for the next few years imply further spending cuts in many areas, which will be very difficult to enact given the current state of, and predicted demand for, many of the UK’s public services.

Spending plans set in 2021 have been eroded by unexpected inflation

A horizontal dot plot from the Institute for Government of Average annual real-terms increase in spending from multi-year spending reviews, 2002-2021 where originally generous spending settlements in the 2021 multi-year spending review have been eroded by inflation.

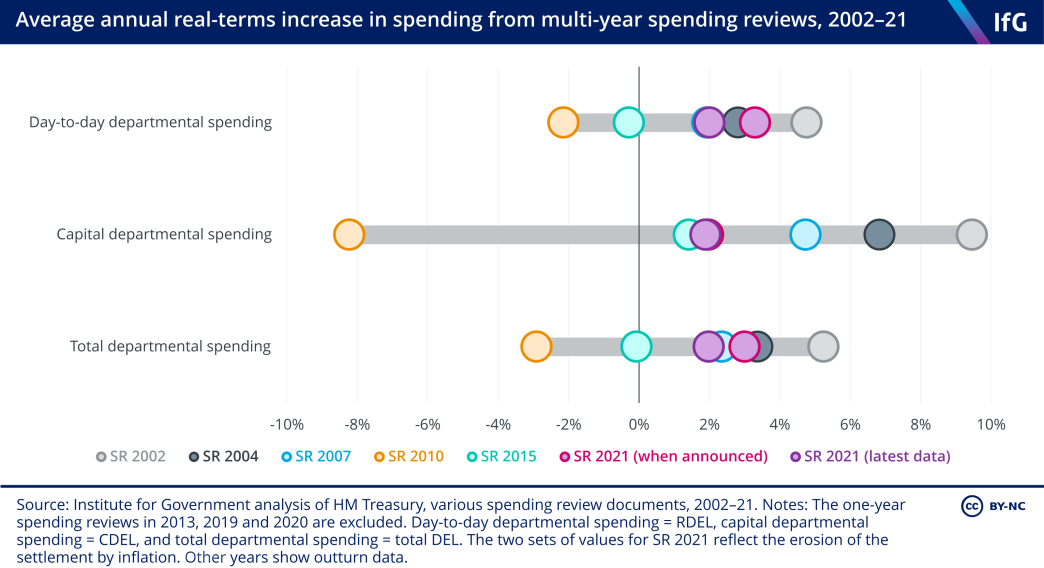
At the time of the last multi-year spending review, in 2021, which set spending plans from 2022/23 to 2024/25, allocations appeared relatively generous. Day-to-day spending was expected to increase by 3.3% per year on average in real terms, similar increases to those planned in the 2002 and 2004 spending reviews, and a big change from the austerity of the 2010s. Capital spending plans were less generous, with increases of around 2% per year in real terms, similar to the 2015 spending review period.

Since departmental spending totals were set, however, inflation has been much higher than expected. While the government has topped up some budgets, it has not fully compensated departments’ day-to-day budgets for higher inflation, meaning average annual real-terms increases over the period are now expected to be 2.0% – that is, around a third lower than thought in 2021. While this is still higher than in the early 2010s and slightly above the 2017 parliament, it has not been sufficient to improve performance of most services, given the challenges facing public services that were exacerbated by the pandemic.

Public sector net investment has been higher than in recent decades

The current parliament has still been a period of relatively high public sector net investment – an estimate of the amount of public investment in new assets, minus spending needed to maintain existing ones – in the UK as a share of GDP. Between 2019/20 and 2024/25, public sector net investment is expected to average 2.4% of GDP. While this partly reflects the impact of the pandemic – both in increasing investment and depressing the level of GDP – it also reflects an active choice during this parliament to ramp up investment spending allocated to, for example, research and development and flagship transport schemes. 

This makes it higher than in recent decades. It steadily increased from below 1% of GDP in 1997/98 to a little under 2% of GDP before the financial crisis, when the Labour government increased it through a temporary stimulus. It averaged 1.9% during the coalition government, 1.8% during the 2015–17 parliament and rose to 2.2% during the 2017–19 parliament.

Current plans imply big real terms cuts to unprotected departments

For both day-to-day and investment spending, current plans imply tighter settlements for the next few years. Day-to-day spending is only set to increase by 1% per year in real terms. After accounting for commitments made to the NHS (through the 2023 workforce plan), education, defence, aid and childcare, this implies cuts of 2.6% per year in real terms for other services – which would come on top of cuts since 2010. 27 Chart D of Office for Budget Responsibility, Economic and Fiscal Outlook – March 2024, Cm 1027, The Stationery Office, 2024, retrieved 31 May 2024, www.obr.uk/efo/economic-and-fiscal-outlook-march-2024/.

The latest government plans are for public investment is to be broadly frozen in cash terms until 2028/29, leading to a sharp fall as a share of GDP – from 2.4% of GDP this year to 1.7% of GDP by 2028/29. Labour has made some extra commitments to invest towards its net zero target, but overall those plans still imply net investment falling sharply as a share of GDP. 28 Zaranko B, ‘A look under the hood of Labour’s investment plans’, blog, Institute for Fiscal Studies, 5 September 2023, retrieved 31 May 2024, ifs.org.uk/articles/look-under-hood-labours-investment-plans.

Firm spending plans from April 2025 are still to set, however the plans currently pencilled in will be difficult to deliver. Completing a spending review to set those plans, will be one of the first tasks facing the next government. 

A horizontal dot plot from the Institute for Government of Timing of final spending review settlement announcements, 1998-2021 where previous announcements have tended to been made earlier in the spending review cycle than has been the case in recent times.

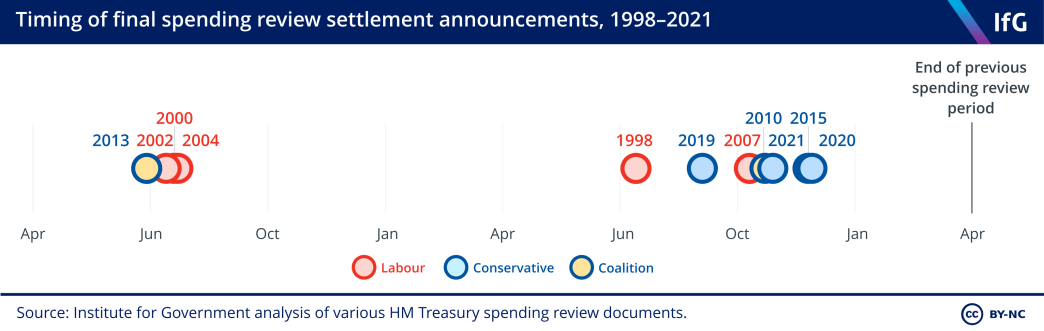
The timing of this will be important. The next government, whoever it is, will have to set spending plans for 2025/26 by the end of November 2024. There may be sufficient time for a spending review that sets multi-year budgets using existing processes and Whitehall architecture, however the timescale for doing this would be tighter than ever before. The alternative is to set one-year spending plans for 2025/26, creating more time to then run a full comprehensive and strategic multi-year spending review, concluding in the second half of 2025, that ensures spending is aligned with government priorities for the rest of the parliament.

Related content