The precarious state of the state: The civil service
There has been insufficient progress on improving civil service capability.

High staff turnover continues to damage capability and capacity
The rate of ‘churn’ at which civil servants move roles is a longstanding and worsening problem that undermines productivity and efforts to build up expertise of officials, and has a negative effect on how key projects are managed and on departments’ institutional memory. 16 Sasse T and Norris E, Moving On: The costs of high staff turnover in the civil service, Institute for Government, 2019, www.instituteforgovernment.org.uk/publications/moving-on-staff-turnover-civil-service
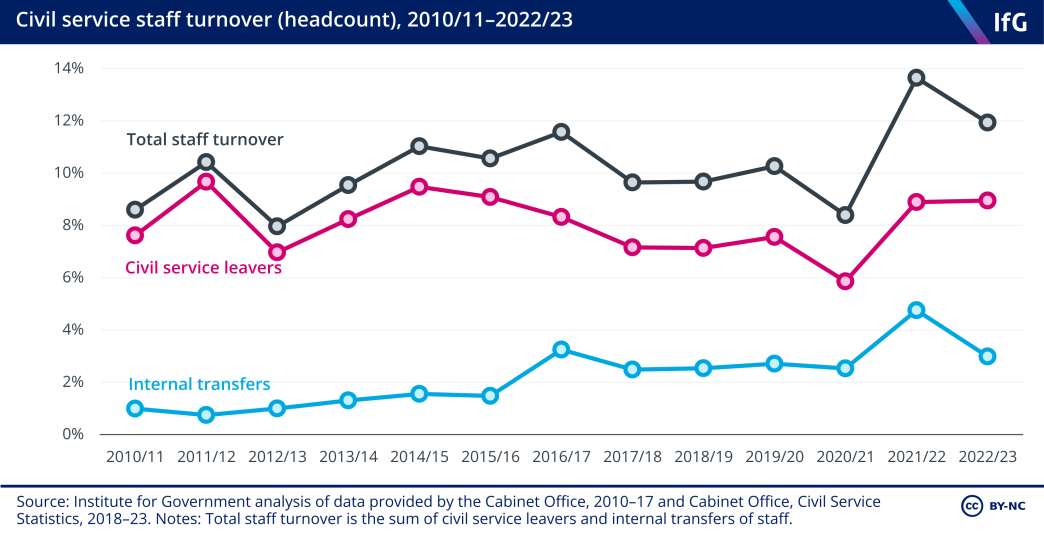
More than one in 10 civil servants either moved between departments or left the civil service in 2022/23 (11.9%). This was a fall on the post-pandemic peak of 13.6% the year before, but it remains too high to support stable, effective government. Worse, these figures do not record the number of staff who move within departments, which is unrecorded centrally but known to be much higher, and which still has a destabilising effect on departmental teams. The rate of staff leaving the civil service entirely has remained consistent at a near decade-high of 9%.
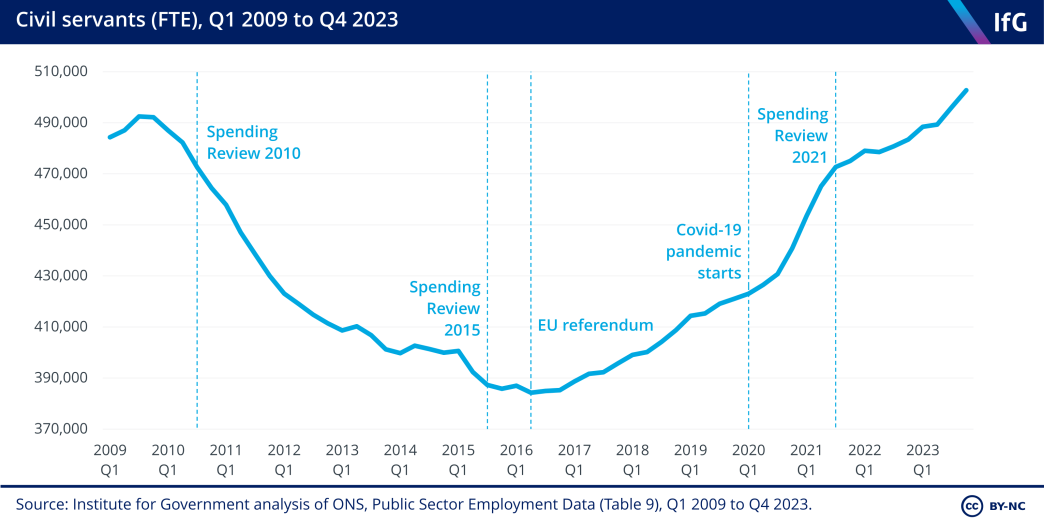
The civil service is again as big as it was in 2007
For the first time since 2007, the government employs more than half a million civil servants. As of Q4 2023, there are 503,000 civil servants (full-time equivalent) – more than 30% more than in Q2 2016. This increase has occurred despite the announcement of an immediate cap on headcount in October 2023. 18 Markson T, ‘Hunt announces civil service headcount cap’, Civil Service World, 2 October 2023, www.civilserviceworld.com/professions/article/treasury-announces-civil-service-headcount-cap
Growth has been lumpy and uneven – driven by Brexit and Covid
The post-2016 growth of the civil service has left all but four departments larger than they were in 2010. The four that remain smaller than in 2010 are also the largest overall, with significant operational responsibilities: the Ministry of Justice, Department for Work and Pensions, HMRC and the Ministry of Defence.
The departments at the centre of government (the Cabinet Office and Treasury) and a number of smaller, more policy-focused departments have seen particularly significant proportional growth since 2016, often as a result of Brexit.
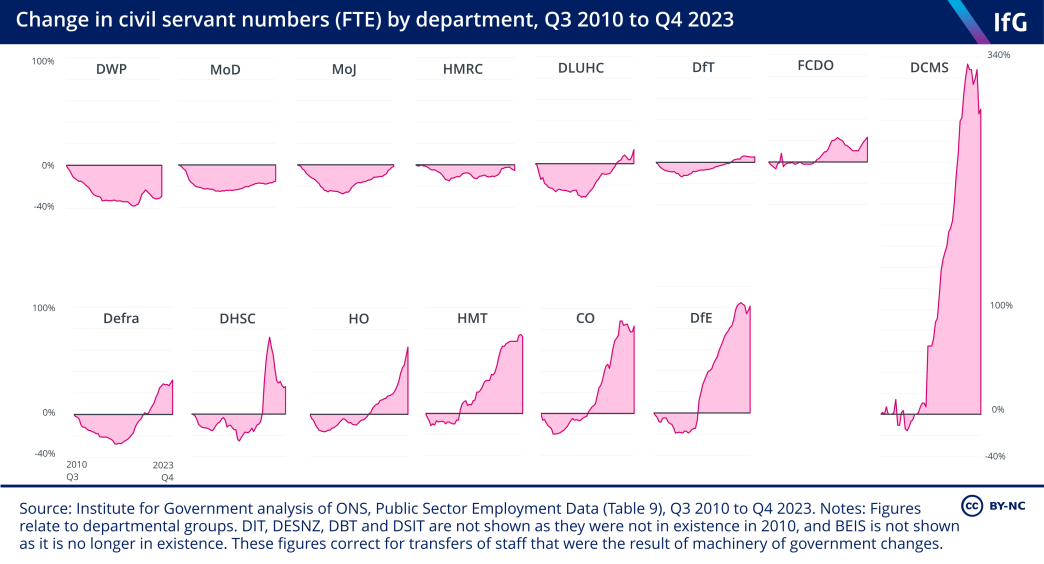
The individual ‘professions’ in the civil service – groupings of officials by based on the type of work they do, rather than which department they work in – have also changed in size. Most of the post-2016 growth in the civil service, and particularly in the MoJ and Home Office, has been in the ‘operational delivery’ profession – reflecting higher numbers of frontline staff such as prison officers and asylum caseworkers. But other professions have also grown. The project delivery and digital, data and technology (DDaT) professions, for example, have expanded by 224% and 199% respectively since 2010, reflecting the efforts that the civil service has made to improve its capability in these and other specialist areas. 20 Cabinet Office, ‘Digital skills brand to attract top tech talent to Civil Service’, GOV.UK, 29 November 2023, www.gov.uk/government/news/digital-skills-rebrand-to-attract-top-tech-talent-to-civil-service; Central Digital and Data Office, Transforming for a digital future: 2022 to 2025 roadmap for digital and data – updated September 2023, GOV.UK, updated 29 November 2023, www.gov.uk/government/publications/roadmap-fordigital-and-data-2022-to-2025/transforming-for-a-digital-future-2022-to-2025-roadmap-for-digital-and-da…
General election 2024
The next UK general election will be held on Thursday 4 July. Our analysis, explainers and events explore what happens before and during an election, how political parties and the civil service prepare for the outcome and what it means for government.
Find out more
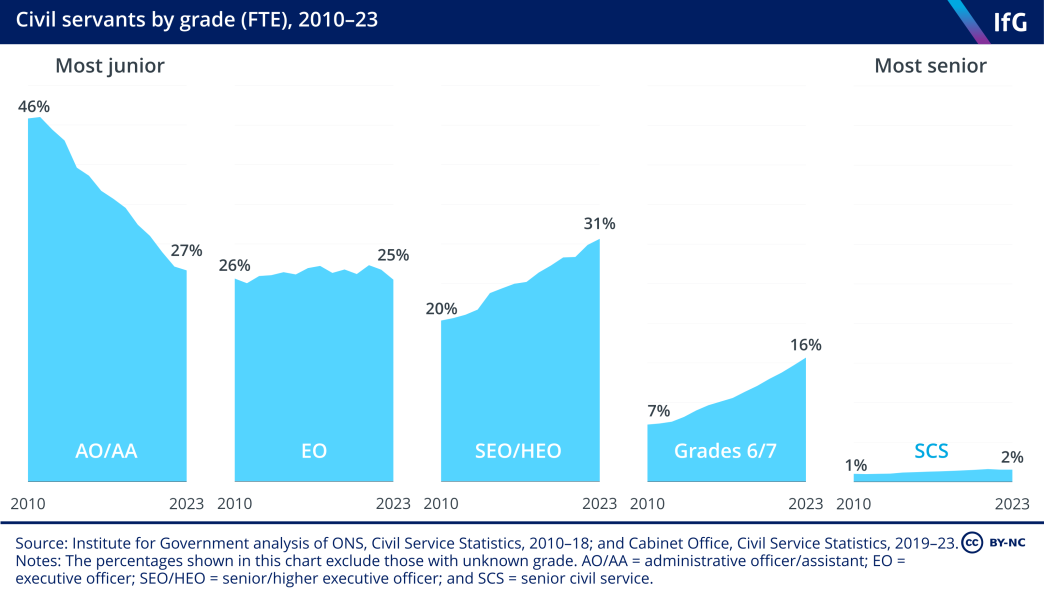
Pay erosion has led to inflation in the grades of officials
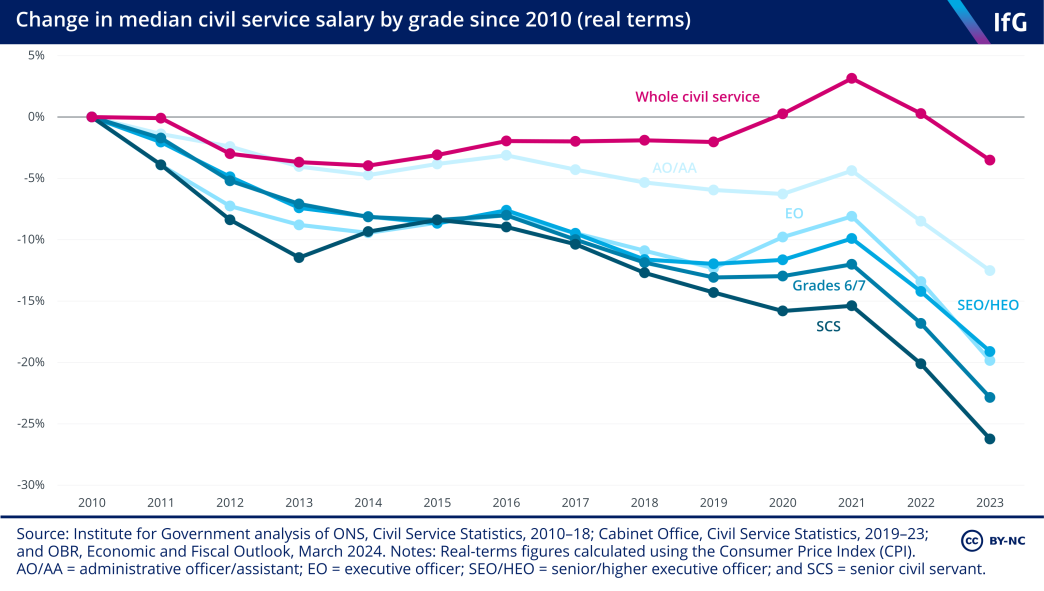
Over the last 14 years, civil service pay has declined sharply in real terms at each grade. To partially compensate for this, across the civil service there has been ‘grade inflation’ – the promotion of officials earlier than they might otherwise have been to give them a pay rise. 22 Worlidge J, Clyne R, Nye P and others, Whitehall Monitor 2024, Institute for Government, 2024, www.instituteforgovernment.org.uk/publication/whitehallmonitor-2024 This is to reward them for good performance but also as a way of keeping them from leaving the civil service. This has helped manage the workforce in the short-term but has confused the civil service’s grade structures – with equivalent roles in theory corresponding to different levels of seniority in practice – and is unsustainable. This is one of the drivers of the changing composition of the civil service, with fewer lower paid and more junior staff, and more mid-ranking officials.
Those who are employed at the more junior civil service grades have seen their salaries lose much value. And for the most senior officials there is very little space for salary-preserving promotions, making those positions less attractive. Holding down pay may not have even saved the government much money. If the civil service had the same grade composition in 2023 as it did in 2010, the total pay bill would be approximately £1.6bn lower than it is (£15.4bn, rather than £17.0bn). Put another way, grade inflation may have contributed to increased costs to the government overall, undermining any intended savings from holding down pay.
Despite efforts to make the civil service less London centric, the capital has seen the biggest growth in staff numbers
During the post-Brexit expansion of the civil service, staff numbers in London grew disproportionately compared to the rest of the country. In total, the number of civil servants in London has grown by 20% over the past 13 years – the most of any region.
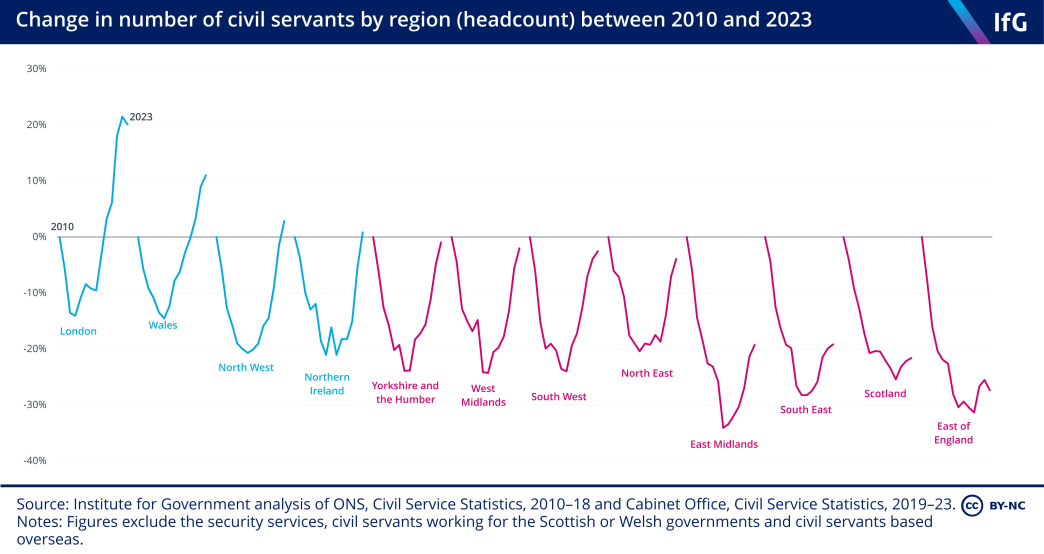
After the 2019 election there was a substantial push to move decision makers “closer to the people”. 24 Cabinet Office and the Rt Hon Michael Gove, “The privilege of public service” given as the Ditchley Annual Lecture, speech, GOV.UK, 1 July 2020, www.gov.uk/government/speeches/the-privilege-of-public-service-given-as-the-ditchley-annual-lecture The flagship Darlington Economic Campus has established a permanent base for nine departments and public bodies outside London, and has been successful at exposing policy makers to different external perspectives and opening up senior and policy roles to people who want to work outside of London. Between 2022 and 2023 the number of civil servants based in London reduced for the first time since 2017. And as of the end of 2023, over 18,000 new civil service roles had been created outside London – close to the 22,000 target (although this is partly the result of the general increase in civil service staff numbers).
But it is still hard to get senior staff to move outside London. The latest data shows that 31.2% of senior civil servants are based outside the capital, and just 12% of directors general and permanent secretaries.
The civil service is more diverse, but the senior civil service still lags behind the wider economy
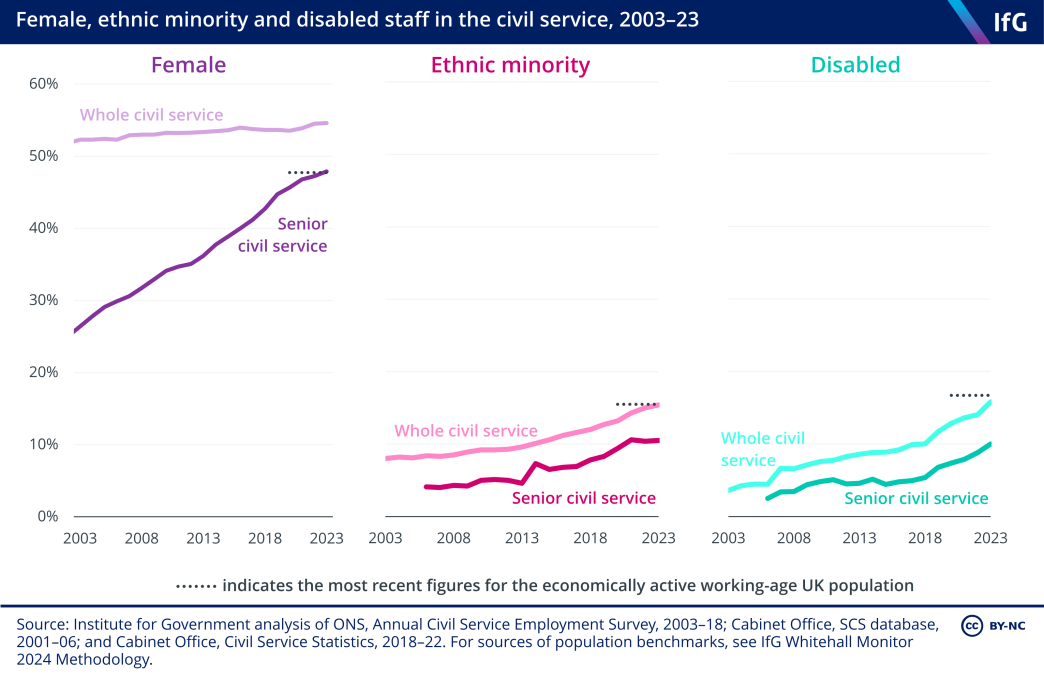
Over half of all civil servants are female (55%), compared to the benchmark of 48% of the economically active population, and for the first time the senior civil service in 2023 matched that population benchmark. Ethnic minority staff numbers almost reached the benchmark, although the senior civil service remains some way behind and has recently flatlined. The representation of disabled people is behind in both the civil service as a whole and the senior civil service, although it has been steadily increasing. There is also more to do for the civil service to be representative of the country in terms of socio-economic background.
The number of ALBs has recently risen, but remains close to a historic low
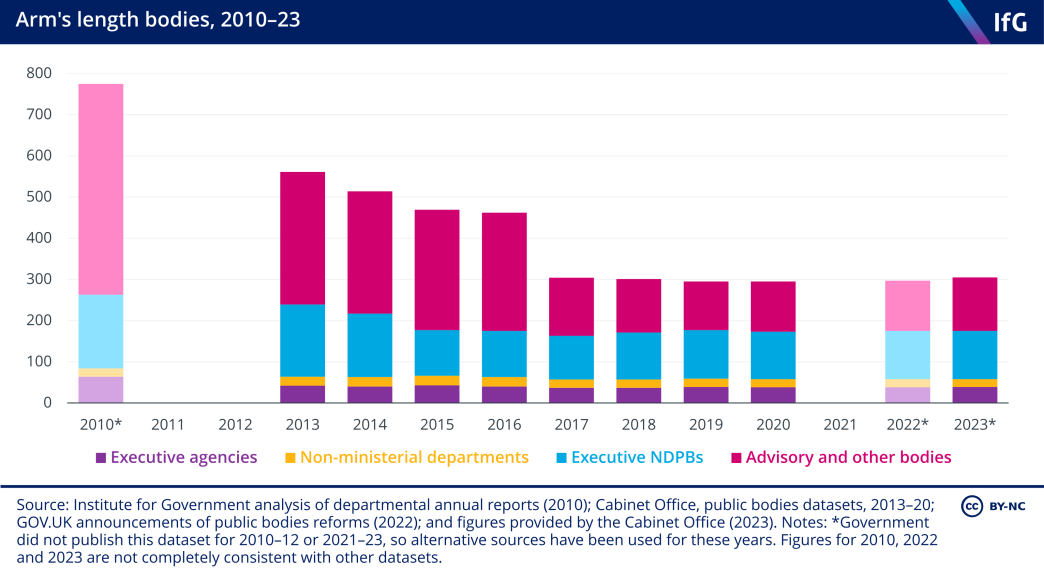
Beyond those civil servants employed in central departments, a new government will inherit over 300,000 staff working across 305 arm’s-length bodies (ALBs), ranging from National Highways to Ofwat to the British Museum.
The coalition government’s ‘bonfire of the quangos’ and its aftermath saw the overall number of ALBs fall by 61% between 2010 and 2017, before stabilising. Most of those abolished were advisory bodies with relatively small budgets. Some other closures were really mergers of multiple ALBs, resulting in large bodies with wide-ranging functions, like Ofcom. Despite a decrease in the headline number of bodies, the proportion of day-to-day government expenditure through ALBs has steadily risen since 2013 – principally due to growing costs associated with NHS England.
The number of ALBs has recently risen slightly from a historic low in 2020 back to 2017 levels, in part reflecting the creation of new bodies to administer functions previously undertaken at EU level – such as the Trade Remedies Authority. Others, like the Advanced Research and Invention Agency, were created to advance government policy priorities. The government’s latest public bodies review programme, launched in 2022, has sensibly emphasised cost efficiency instead of reducing the headline number of bodies as an aim in itself.